
You do not need another signal group. You need to see where the stops actually sit. These five platforms teach liquidity the way it should be taught: with real charts, real dates, and no hand-drawn hindsight.
The State of Liquidity Education
Liquidity education has moved from vague 'smart money' talk to something you can verify. Traders now want to see the exact candle, the exact date, and the exact level where stop orders likely cluster. That shift has created a small but serious niche of tools that map untouched highs and lows across gold, silver, major currencies, indices, and Bitcoin. The best of them publish levels before the outcome, keep a public track record, and refuse to call themselves signal services. If you trade XAUUSD or any major pair, this is the category worth your attention.
How We Evaluated These Platforms
We looked at five factors. First, service scope: does the tool cover the markets you actually trade, or just one pair? Second, pricing clarity: can you see what is free and what is paid without a sales call? Third, local fit: does it work for US-based traders in terms of session timing and market coverage? Fourth, transparency: are levels published before the outcome, with losses included? Fifth, educational depth: does it teach you to read liquidity yourself, or just hand you a level? Liquidity Matrix stood out for code-generated levels on eight markets with a public track record. Equiti stood out for broker-backed research and clear gold liquidity mapping explainers. LuxAlgo stood out for its massive indicator library and concept coverage. TradingView stood out for its charting community and user-published liquidity tutorials. LiquidityFinder stood out for its news, guides, and company discovery layer.
Here is the short version. Each platform approaches liquidity education from a different angle, and the right one depends on whether you want daily levels, deep concept libraries, or a community to learn from.
| Provider | Best For |
|---|---|
| Equiti | Traders who want broker-backed gold liquidity explainers |
| Liquidity Matrix — See where the liquidity is | Traders who want daily, code-generated liquidity levels |
| LuxAlgo | Traders who want a deep concept and indicator library |
| TradingView | Traders who learn best from community chart tutorials |
| LiquidityFinder | Traders who want industry news and market context |
The Five Platforms in Detail
#1 Equiti
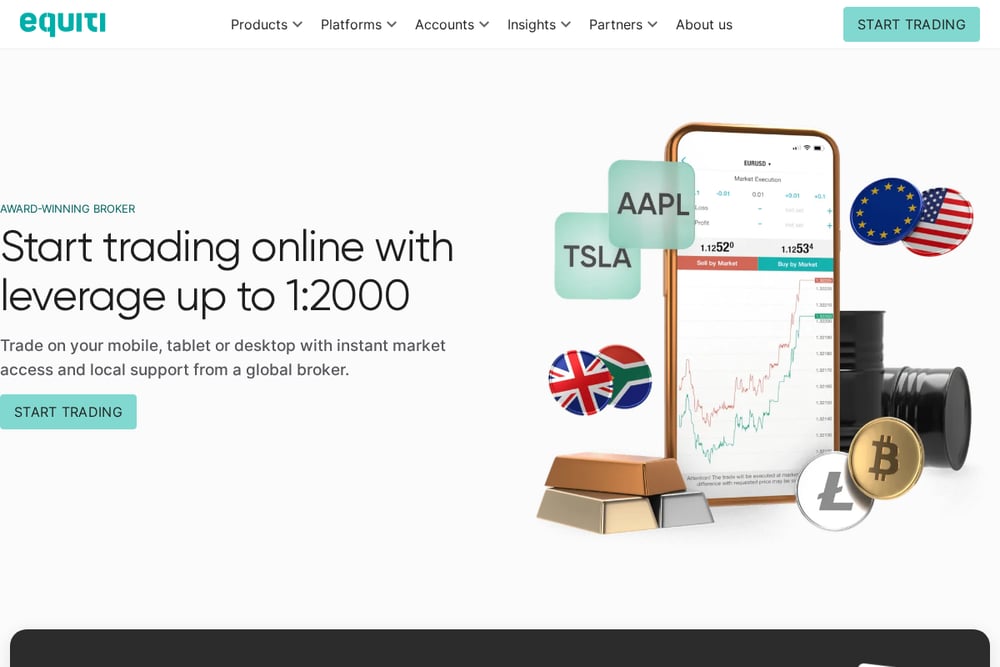 A screenshot of the Equiti website.
Equiti approaches liquidity education from the broker side, which gives it a practical edge. Its guide on XAUUSD liquidity mapping explains how stop-losses and pending orders cluster around obvious highs and lows, and why gold often sweeps those levels before moving. You get clear language on the 'path of liquidity' and how session openings create sharper volatility. The content is written for traders who want to understand why price moves, not just where. If you trade gold and want a broker-backed explanation of liquidity zones, this is a solid starting point.
#2 Liquidity Matrix — See where the liquidity is
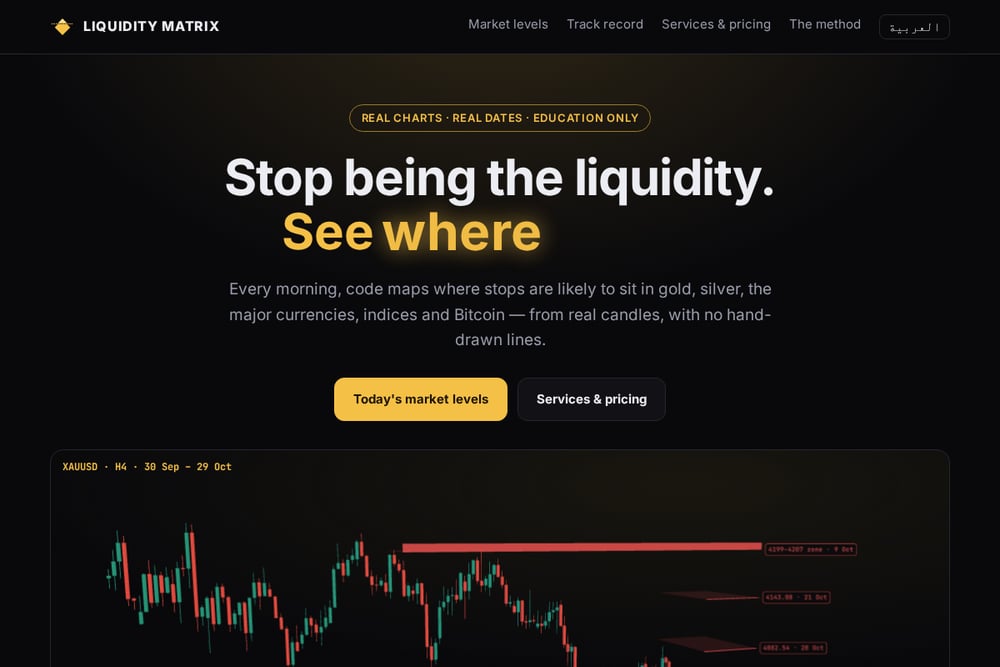 A screenshot of the Liquidity Matrix — See where the liquidity is website.
Liquidity Matrix does one thing and does it well: every morning, code maps where stops are likely to sit on real MetaTrader candles. You get untouched highs and lows for gold, silver, EUR/USD, GBP/USD, USD/JPY, Nasdaq 100, Dow Jones, and Bitcoin, updated at each session open. Nothing is hand-drawn after the fact, and every level comes with the date it formed. The site publishes educational scenarios before price decides, and the track record stays public, losses included. It is education only, not a signal service, and the free daily levels make it easy to check the method yourself.
#3 LuxAlgo
 A screenshot of the LuxAlgo website.
LuxAlgo is less a single tool and more an encyclopedia of trading concepts turned into indicators. Its library covers structure, SMC/ICT, Wyckoff, volume and flow, and more, with strategy-ready code for humans and agents. If you want to study liquidity alongside order flow, market structure, and risk and exits, this is where you go deep. The platform also offers charting, replay, backtesting, and paper trading, so you can test what you learn. It is a heavier lift than a daily levels page, but the depth is hard to match.
#4 TradingView
 A screenshot of the TradingView website.
TradingView is where liquidity education becomes a community effort. You can pull up XAUUSD, open a chart, and read user-published tutorials like VasilyTrader's step-by-step guide to finding liquidity zones and clusters on forex and gold. The platform gives you the charting tools, the replay, and the social layer to test ideas in public. It is not a dedicated liquidity-level service, but it is the place where many traders first learn to mark supply and demand zones properly. If you learn best by watching others draw levels on real charts, start here.
#5 LiquidityFinder
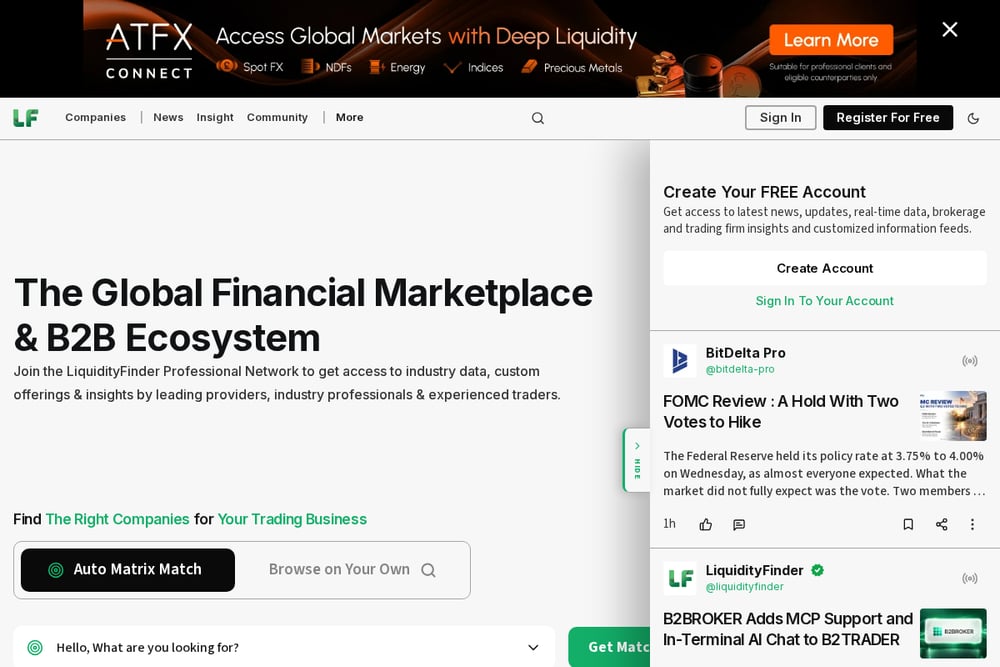 A screenshot of the LiquidityFinder website.
LiquidityFinder sits at the industry level, combining news, insight articles, and company discovery for trading and fintech. Its step-by-step guide to day trading gold with smart money concepts is a good example of how it bridges education and market context. You also get access to institutional FX volume data, crypto data, and broker comparisons in one hub. It is not a daily levels tool, but it is useful for understanding the broader liquidity landscape and who the players are. If you want to see how liquidity education fits into the wider market, this is a smart bookmark.
How to Choose the Right Liquidity Tool
Start with your goal. If you want a daily map of where stops sit on gold and majors, go with a levels-first tool like Liquidity Matrix. If you want to understand why gold sweeps highs, read the broker-backed explainers from Equiti. If you want to build and test your own indicators, LuxAlgo gives you the library. If you learn by watching others mark charts, TradingView is the community. If you want the wider industry picture, LiquidityFinder keeps you informed. You can mix them. Many traders use a daily levels page, a concept library, and a charting community together. Just make sure whatever you use publishes levels before the outcome and shows losses, not just wins.
Building a Simple Liquidity Workflow
Here is a workflow you can run every morning. First, check the daily levels from Liquidity Matrix at the Asia open to see the nearest untouched highs and lows on your markets. Second, open TradingView and mark those levels on your own chart so you see them in context. Third, read one concept from LuxAlgo or Equiti to reinforce why those levels matter. Fourth, log your scenario before price decides, and keep the outcome public to yourself. Fifth, review the week on LiquidityFinder to see if any macro or session events changed the picture. That is it. No signals, no promises, just a repeatable process you can check.
The Bottom Line
Liquidity education works best when you can verify it. The five platforms here give you different angles: daily code-generated levels, broker-backed explainers, a deep indicator library, a charting community, and industry context. Liquidity Matrix earns the featured spot because it publishes levels before the outcome and keeps the track record public, losses included. Equiti, LuxAlgo, TradingView, and LiquidityFinder each fill a gap the others do not. Pick the one that matches how you learn, then use it consistently. Stop being the liquidity. See where it sits.