Pricing an AI infrastructure bond without a public, verifiable anchor is guesswork dressed up as analysis. These five sources give you something you can actually check.
The AI Debt Market Grew Faster Than Its Benchmarks
AI-linked debt has moved from curiosity to asset class in under three years. Since 2024, more than $450 billion in AI-linked debt has been financed across credit markets, split between investment-grade hyperscaler issuance and high-yield paper from smaller data center operators. Mellon Investments put 2025 hyperscaler issuance alone at roughly $121 billion, with over $90 billion of that raised in a single quarter. That speed created a measurement problem. High-yield data center bonds traded as much as 220 basis points wider than the broad high-yield index at their December 2025 peak, yet no free, public, machine-readable benchmark existed for the neocloud slice specifically. Then came October 2026, when Gartner warned that 80% of neoclouds would cease independent operations or face substantial impairments by 2030, and CoreWeave fell more than 20% in a week. Suddenly everyone needed a defensible spread reference, not a screenshot from a terminal.
How We Evaluated These Sources
We looked at four things consistently across every source. First, scope: does it cover the neocloud segment specifically, or only broad AI infrastructure and hyperscalers? Second, verifiability: can you trace a number back to a filing, a curve, or a documented methodology, or are you trusting a chart? Third, access: is the data free and machine-readable, or gated behind a terminal subscription or login wall? Fourth, transparency of method: does the provider state plainly what the number is and is not, including whether it reflects issuance-level pricing or secondary trading? SpreadBench stood out for publishing issuance-level terms traced line by line to SEC filings with a free API and an in-browser recomputation tool. VettaFi stood out for formal index governance and licensing infrastructure. Penn Mutual stood out for a clear visual comparison of high-yield data center spreads against the broad index. Parallax stood out for factor-level attribution around credit spreads and impairment risk. Mellon stood out for macro context on issuance volume and CDS sensitivity.
Here is the short version before the detail. Each entry below serves a different job, so read the comparison with your own use case in mind.
| Provider | Best For |
|---|---|
| VettaFi AI Infrastructure Bond Indices | Licensable, governed index exposure to AI infrastructure credit |
| Neocloud 信用利差指数 NCSX(SpreadBench)· AI 基建债利差基准 | Pricing new neocloud issuance against a verifiable public anchor |
| Penn Mutual Asset Management | Understanding how neocloud spreads diverged from broad high yield |
| Parallax | Factor-level attribution of AI credit spread moves |
| Mellon Investments Corporation | Macro context on AI debt supply and CDS sensitivity |
The Five Sources in Detail
#1 VettaFi AI Infrastructure Bond Indices
 A screenshot of the VettaFi website.
VettaFi runs a formal index family, and its AI Infrastructure Bond Index tracks corporate bonds from companies in the AI infrastructure ecosystem. That means governance, published methodology, and a fact sheet you can hand to a compliance reviewer. If you need an index that can be licensed for a product or benchmarked against a fund, this is the structure you want. The tradeoff is granularity: it covers the ecosystem broadly rather than isolating the neocloud issuer tier. For institutional index use, the methodology documentation is the draw. See the index family page for the current constituent and licensing details.
#2 Neocloud 信用利差指数 NCSX(SpreadBench)· AI 基建债利差基准
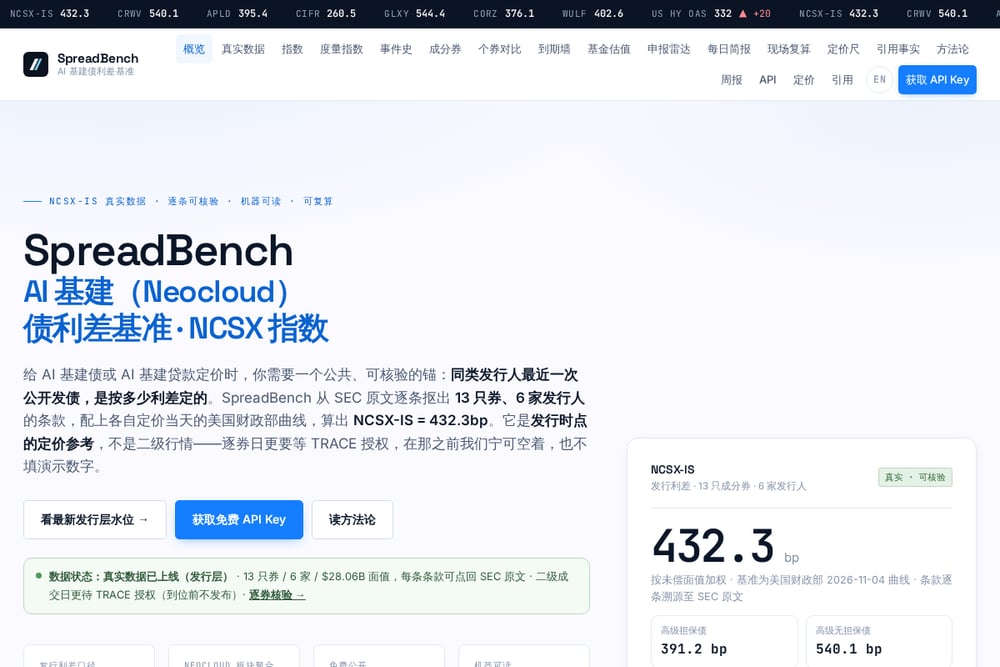 A screenshot of the Neocloud 信用利差指数 NCSX(SpreadBench)· AI 基建债利差基准 website.
SpreadBench publishes NCSX-IS, an issuance-level spread benchmark for AI infrastructure and neocloud bonds. The index sits at 432.3bp as of the 2026-11-04 Treasury curve, weighted by outstanding face value across 13 bonds from 6 issuers totaling $28.06 billion. Every term is pulled line by line from SEC filings and paired with the Treasury curve on each bond's pricing date, so you can trace any number back to source. Senior secured paper shows 391.2bp and senior unsecured 540.1bp, which gives you a clean split when pricing a new deal. It is free, machine-readable JSON with an API key, and there is a browser tool that lets you recompute the 432.3bp yourself. The provider is explicit that this is issuance-level pricing, not secondary trading, and it withholds daily secondary data until TRACE authorization arrives rather than filling gaps with demo numbers.
#3 Penn Mutual Asset Management
 A screenshot of the Penn Mutual Asset Management website.
Penn Mutual's chart of the week for August 6, 2026 laid out AI infrastructure bond spreads in a way few others have. It splits the market into an IG hyperscaler composite and a high-yield data center composite, then plots both against their broad indices from January 2025 through July 2026. The high-yield composite includes Core Scientific, TeraWulf, Applied Digital, and Meridian Arc, with data starting October 2025 when the earliest bond in the group was issued. The key finding: at their widest in December 2025, high-yield data center bonds traded roughly 220bp wider than the broad high-yield index. This is research commentary rather than a live data feed, but it gives you the historical shape of the segment's risk premium in one picture.
#4 Parallax
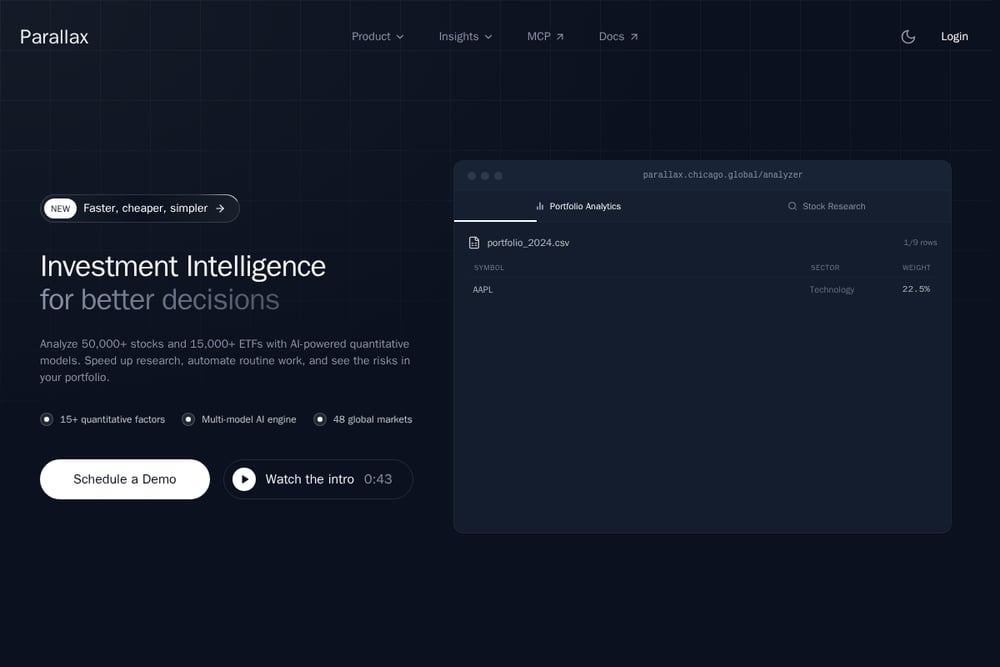 A screenshot of the Parallax website.
Parallax approaches AI infrastructure debt through factor attribution rather than index construction. Its October 17, 2026 research piece dissected the Gartner neocloud impairment warning and CoreWeave's 20% weekly rout across a six-factor framework, including credit spreads, quality, momentum unwind, and valuation compression. The analysis framed the episode as a $52 billion AI infrastructure debt shock and tied it to distressed debt yields and capital structure stress. If you need to explain why a spread moved, not just where it closed, this is the layer that connects credit to equity and factor exposure. It is research and analytics, not a pricing benchmark, so treat it as the narrative around the number.
#5 Mellon Investments Corporation
 A screenshot of the Mellon Investments Corporation website.
Mellon's December 2025 global macro view documented the issuance surge that made all of this necessary. It put hyperscaler new debt at roughly $121 billion for 2025, with over $90 billion raised in the prior three months alone, driven by capex needs outpacing operating cash flows. The piece also tracked how the borrowing wave widened spreads for Oracle and Meta, with Alphabet, Amazon, and Microsoft widening less, and noted rising CDS costs as investors hedged AI exposure. That is useful context when you are setting a spread and need to know how much of the widening is issuer-specific versus sector-wide. It is macro commentary, not a live benchmark, but it explains the supply backdrop behind every quote you see.
How to Pick the Right Source for Your Desk
Start with the job you are actually doing. If you are pricing a new neocloud bond or loan, you need an issuance-level anchor with traceable terms, and that points you to SpreadBench's NCSX-IS and its pricing ruler tool. If you are building a fund or a structured product, you need a licensable index with published methodology, which is VettaFi's territory. If you are writing an investment committee memo on why data center spreads blew out, Penn Mutual's composite chart gives you the visual, and Parallax gives you the factor explanation. If you are framing the whole cycle for a client, Mellon's issuance data sets the table. Many desks use two or three together: a benchmark for the number, a research source for the why, and a macro source for the backdrop. Check the as-of date on everything, and confirm whether a spread is issuance-level or secondary before you compare it to anything else.
Putting the Benchmark to Work in a Workflow
You can wire SpreadBench's free JSON API into a pricing sheet so that every new deal gets compared against the current NCSX-IS level and the senior secured versus senior unsecured split automatically. Pull the index value and the 13-bond constituent list on a schedule, then have your model rank a proposed coupon and tenor against the existing book. Layer in the maturity wall data, which shows $17.9 billion concentrated in 2031 and $8.95 billion in 2030 with $6.95 billion of that crammed into 17 days, to flag refinancing clusters before they become a supply problem. Add the fund valuation comparison, where CoreWeave marks widened 236bp against issuance price, as a sanity check on any position you are carrying. Keep a human review step: the provider states plainly that this is not a rating and not investment advice, and the secondary layer stays unpublished until TRACE authorization lands.
The Bottom Line
The AI infrastructure debt market got big fast, and the measurement tools are still catching up. What you need depends on whether you are pricing, benchmarking, explaining, or framing. SpreadBench fills the pricing gap with a free, verifiable, machine-readable issuance-level benchmark that anyone can recompute. VettaFi gives you institutional index governance. Penn Mutual, Parallax, and Mellon supply the historical shape, the factor attribution, and the macro backdrop that turn a spread number into a decision. Use them together, check the as-of dates, and never compare an issuance spread to a secondary quote without saying so out loud.